Hi,
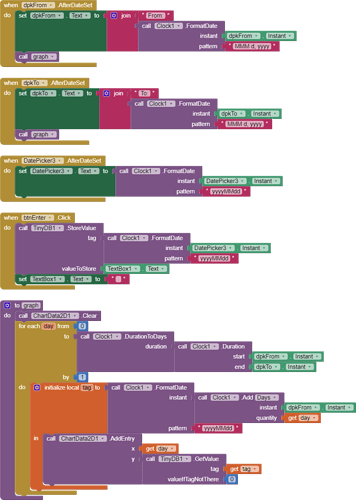
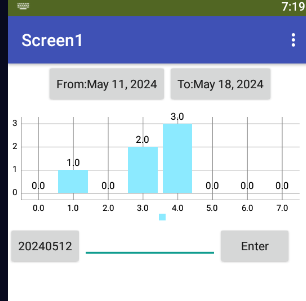
I have been trying to connect the contents from a TinyDB (tag -> date in ddmmyyyy format, value -> integer) to a bargraph.
I've looked at the histogram example but I can't make any sense of the ChangeDataSource's second parameter, ie "keyValue". The first one "source" is kind of logic, where you choose the TinyDB, but what about the "keyValue"?
Can you help me or direct me to a web example?
Thanks
There is a section on TinyDB in the Charts documentation. Have you tried using that approach? If so, can you attach a project that demonstrates the issue you are encountering?
Let me have a look.
Thanks
The example in the link you sent has a tag associated with an array of values:
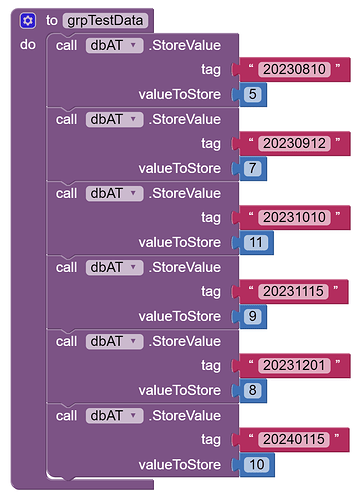
my app has a tag per value:
As I mentioned before, I'm assigning a value per date.
Notes:
- this is a simple function that generates test data
- the date is actually in yyyymmdd
You will have to massage your data to fit a chart.
See the third link at
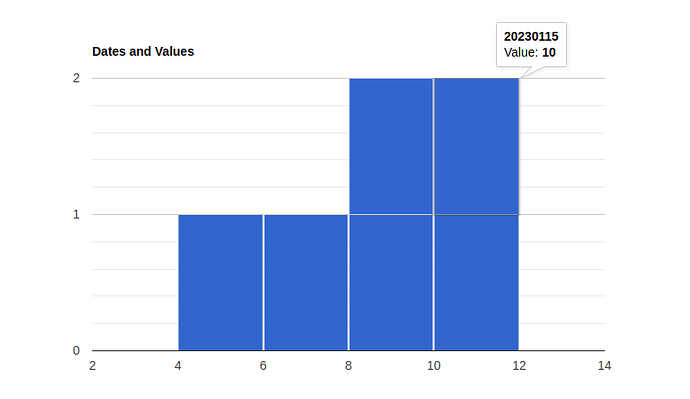
Using Google Charts (with your data, would require network connection)
<html>
  <head>
    <script type="text/javascript" src="https://www.gstatic.com/charts/loader.js"></script>
    <script type="text/javascript">
      google.charts.load("current", {packages:["corechart"]});
      google.charts.setOnLoadCallback(drawChart);
      function drawChart() {
        var data = google.visualization.arrayToDataTable([
          ['Date', 'Value'],
          ['20230810',5],
	      ['20230912',7],
	      ['20231010',11],
	      ['20231115',9],
	      ['20231201',8],
	      ['20230115',10]
          ]);

        var options = {
          title: 'Dates and Values',
          legend: { position: 'none' },
        };

        var chart = new google.visualization.Histogram(document.getElementById('chart_div'));
        chart.draw(data, options);
      }
    </script>
  </head>
  <body>
    <div id="chart_div" style="width: 900px; height: 500px;"></div>
  </body>
</html>
Initially it was using Google Charts but sometimes the location where the app is supposed to be used, i.e. in the middle of a vineyard, the network/data signal is not that good, thus I had to abandon it and move to something local.
Nevertheless, thanks for the suggestion.
Regardless, you would still need to make an AI2 list of all the tags and values, as shown above, in order to feed the chart component. Your data storage method will become unwieldy if you have many many dates and values to store, it may well be better to store in just one tag your data array.
Thanks TIMAI2, it seems that I have to change my approach...
(as if it wasn't enough, now nothing seems to compile with a "D8 error"...)


