I did. I am getting latest.

Deleting and refollowing your steps.
I did. I am getting latest.

Deleting and refollowing your steps.
You may need to set your Screen to Scrollable and scroll down...
Scrollable needed set but sill not seeing chart.
Curious - Title is not showing either?
Look for "for each in list" blocks and check they really are given lists and not individual numbers like "10.0".
I got the graphs working but my table data is displayed not in order?
Can I display the dates at the bottom w/o the year?
If the data is more than displayed, is there a way to scroll backwards in data?
Your x axis needs work.
Human readable date time values don't sort alphabetically, so you need humbler coordinates.
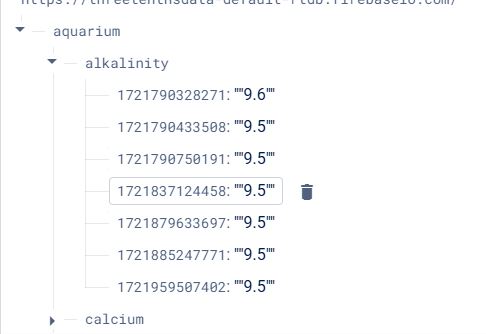
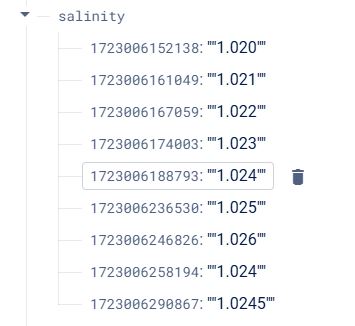
The dates are stored in mills and converted. The data is not coming from a CSV file but from Firebase.
You may need to sort your arraytable by date (string). Add these blocks after the arrayTable is created:
The dates are alphanumeric date strings:
2024-07-24-1221
2024-08-02-1432
The data just needs sorting (In my example, all entries were posted in "date" order, so did not require sorting. The OP's data is not in date/sorted order.
The sort works - thank you
I spoke too soon.
The graph does not match the data.
attached is block, graph and data
I have not found the Bad List Argument error either (above)

OK, the issue with the chart is possibly where values have the same hour and minute. The solution is to sort the data as it is when it is returned, so sorting the millis values, then to convert the millis to a human readable string value of your choice (MM-dd-HHmm ?) for the chart.
It is possible to "stretch" the chart to the right, and then be able to scroll the data. See HERE
Follow @ABG's advice to find the for each in list block that is causing the problem
When I move the sort up under the display list creation, i get a bad argument error. Even if I change the pattern to include the HHmmm.
If I take off the format date and sort on the original format?
Then build array with the change?
Herewith the updated aia (you will need to add your own firebaseurl again)
aquariumFBwithChart_sorted.aia (16.7 KB)
Thank you. I will download and start reading
I got the sort working - thank you
I changed the listview to a chartmarkerplus table and that too is working.
I am now trying track down the "Bad list argument to foreach: It is occuring when I am trying to go from the Graph virtual screen, back to Screen1. It says " The second argument is ":07". which happens to be the last value for phosphates. If I change the data in phosphates, the error message changes. The error happens as the Screen1 is repainted and populated.
There are only two "for each" - the first is the for each Key with Value in dictionary get value, and the second is for each itemin list get data table.
This topic was automatically closed 7 days after the last reply. New replies are no longer allowed.