Hello,
I have a timer that collects angle values over a period of time. When I stop the timer, I would like to generate a graph displaying all the collected values. This graph should clearly show how the angles changed over the recorded time.
Currently, I have a real-time graph implemented, but it has an issue: the data gets eliminated over time. I need a solution that preserves the data so users view the entire set of angle values in a clear graph.
Is there a way to achieve this? Any guidance on how to set this up would be greatly appreciated.
I am using an Arduino Nano 33 IOT to send data via Bluetooth to my phone.
Attached are both the .aia file and the Arduino code.
bluetoothbrain_test_2_copy2_copy3_Screen_checkpoint1.aia (243.7 KB)
Leeper_Bluetooth_Counter.ino (2.8 KB)
Thanks!
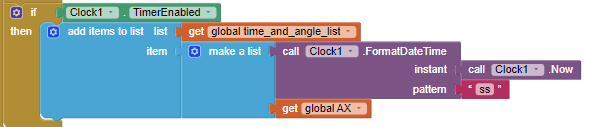
This is the part that makes the list.