Recently, we have a built-in Chart component. It may not be perfect yet, but it has very interesting and extensive functions. It contains data receivers from several components. Among other things, from the Bluetooth component, which I would like to discuss here.
We add the Chart component to the project and then the ChartData2D data coordinator.
In my example app, I added two such coordinators. For temperature and pressure.
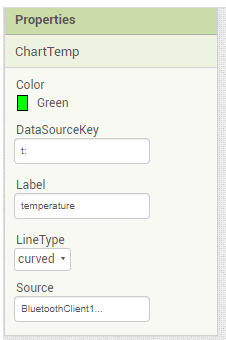
In the ChartData2D component we have settings related to data receivers.

Source: we select our BluetoothClient component.
DataSourceKey: prefix of the message received via bluetooth. In our case "t:".
Blocks:
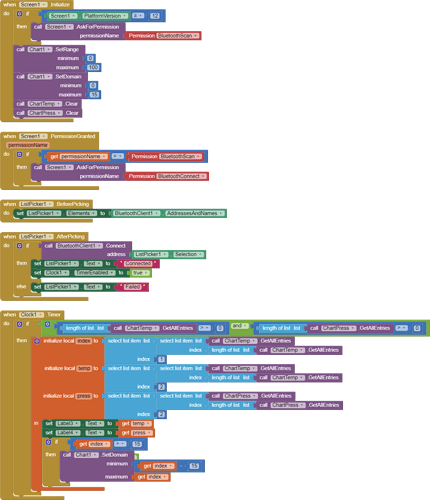
As you can see, most of the blocks are connecting to bluetooth and initializing the Chart.
As you can see, there is no block for reading data from bluetooth anywhere. All this is done for us by the Chart component that sets the appropriate receiver.
The block we are most interested in is the Clock block. We use it to dynamically scroll the graph when receiving data. The graph shows the last 16 values. I also display the last value in the label.
All received data from bluetooth can be downloaded as a list from the block:

Sample code for ESP32, as you can see in the code, I am sending random values in the loop with prefixes "t:" and "p:", the same prefixes are set on my Chart data coordinators.
#include "BluetoothSerial.h"

const char *pin = "1234"; // Change this to more secure PIN.
String device_name = "ESP32-BT-Slave";

#if !defined(CONFIG_BT_ENABLED) || !defined(CONFIG_BLUEDROID_ENABLED)
#error Bluetooth is not enabled! Please run `make menuconfig` to and enable it
#endif

#if !defined(CONFIG_BT_SPP_ENABLED)
#error Serial Bluetooth not available or not enabled. It is only available for the ESP32 chip.
#endif

BluetoothSerial SerialBT;

void setup() {

  Serial.begin(115200);
  SerialBT.begin(device_name); //Bluetooth device name

  #ifdef USE_PIN
    SerialBT.setPin(pin);
    Serial.println("Using PIN");
  #endif

}

void loop() {

   String t = "t:" + String(random(5 , 95));
   String p = "p:" + String(random(5 , 95));

   SerialBT.println(t);
   SerialBT.println(p);
   delay(100);

}
Here's the whole project:
Chart_and_bluetooth.aia (40.8 KB)
The final result:
