Solve nonlinear least square problem with MIT app inventor

Hello guys, I am trying to create an app that perform nonlinear curve fitting using nonlinear least square method. I can solve the problem with matlab and excel solver. Please I need help with using mit app inventor to solve same problem.

Matlab code below:

% Sample data

xData = [1021.38, 510.69, 340.46, 170.23, 10.2138, 5.1069];

yData = [93, 56, 43, 30, 10, 9];

% Initial guess for parameters [a, b, c]

initialGuess = [7.5, 0.7, 0.55];

% Define the function to fit (model function)

modelFunc = @(params, x) params(1) + params(2) * x.^params(3);

% Set lower and upper bounds for parameters [a, b, c]

lb = [-inf, -inf, 0]; % Lower bounds (set c >= 0 to ensure it remains non-negative)

ub = [inf, inf, inf]; % Upper bounds

% Use lsqcurvefit to fit the model to the data

estimatedParams = lsqcurvefit(modelFunc, initialGuess, xData, yData, lb, ub);

% Extract the estimated parameters

a = estimatedParams(1);

b = estimatedParams(2);

c = estimatedParams(3);

% Display the results

disp(['Estimated Parameters: a = ', num2str(a), ', b = ', num2str(b), ', c = ', num2str(c)]);

% Plot the data and the fitted curve

xFit = linspace(min(xData), max(xData), 100);

yFit = modelFunc(estimatedParams, xFit);

figure;

plot(xData, yData, 'o', 'DisplayName', 'Data');

hold on;

plot(xFit, yFit, 'r-', 'DisplayName', 'Fitted Curve');

xlabel('x');

ylabel('y');

legend('Location', 'best');

grid on;

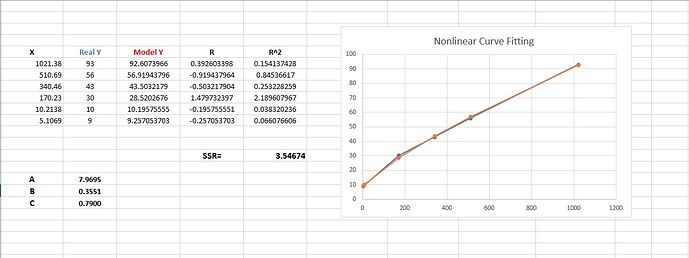
Excel gave same result:
For starters:

image

How about a link to the lsqcurvefit algorithm?

Thanks for your reply. The lsqcurvefit algorithm is an in-built function in matlab just like the solver in excel. Here is a link to the algorithm explanation.

Thanks a lot. Really appreciate every idea to solve this problem.

I plowed through that "algorithm explanation" link.

It's more of a menu of available ways you can ask MATLAB(R) to run the calculation for you.
You need a MATLAB license even to ask for it to generate C code to do the calculation.

Bottom line, MATLAB wants their money.

Let's see what Google can find ...
least squares fit algorithm

Any preference?

Thanks a lot for your reply. I really appreciate every input on this.
I can perform the same calculation using standard LSGRG Nonlinear solver in google sheet. My challenge is how to activate the solver from mit app inventor. Any idea on this?

The AI2 spreadsheet component can add data to a sheet, including =function() expressions.

I do that in this sample ...

Can you find the google range expression for that statistical function?

To automate the solver in google sheet seems to be a challenge since it is and extension. By the way, is there any way I can get this matlab code below as an extension or blocks in mit app inventor?

% Given data

X = [1021.38, 510.69, 340.46, 170.23, 10.2138, 5.1069];

Y = [93, 56, 43, 30, 10, 9];

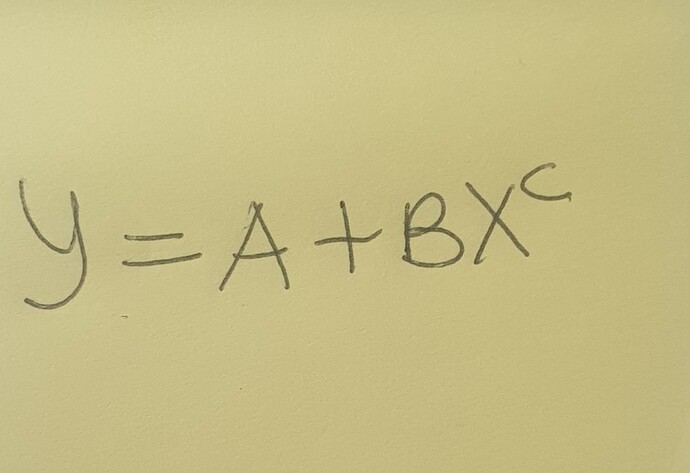
% Define the function y = A + B*(X^c)

f = @(coeffs, x) coeffs(1) + coeffs(2) * (x .^ coeffs(3));

% Define the error function as the sum of squared differences

errorFunc = @(coeffs) sum((f(coeffs, X) - Y).^2);

% Initial guess for coefficients A, B, and c

initialGuess = [7.5, 1, 0.55];

% Perform nonlinear least squares optimization to find the best coefficients

options = optimset('MaxFunEvals', 10000, 'MaxIter', 10000);

bestCoeffs = fminsearch(errorFunc, initialGuess, options);

% Extract the optimized coefficients

A = bestCoeffs(1)+0.211;

B = bestCoeffs(2);

c = bestCoeffs(3);

% Display the optimized coefficients

disp('Optimized Coefficients:')

disp(['A = ', num2str(A)]);

disp(['B = ', num2str(B)]);

disp(['c = ', num2str(c)]);

The X data above stays constant while Y is the user input data.

There is a lump under the complexity rug here.

The real work of iteration to find the minimum least square triple coefficients.

Look for a JavaScript self contained library and apply these techniques

See Apps Script code used in solving the problem in google sheet. Is it possible to get an extension with similar code?

function fitDataWithGradientDescent() {

  var sheet = SpreadsheetApp.getActiveSpreadsheet().getActiveSheet();


  // Data X and Y in cells A2:A7 and B2:B7

  var dataXRange = sheet.getRange("A2:A7");

  var dataYRange = sheet.getRange("B2:B7");


  var dataX = dataXRange.getValues();

  var dataY = dataYRange.getValues();


  // Initial values for A, B, and C

  var A = 7.5;

  var B = 1.0;

  var C = 1.0;


  // Gradient descent parameters

  var learningRate = 0.00000001;

  var numIterations = 100000000;


  // Perform gradient descent to refine coefficients A, B, and C

  for (var iter = 0; iter < numIterations; iter++) {

    var deltaA = 0;

    var deltaB = 0;

    var deltaC = 0;


    for (var i = 0; i < dataX.length; i++) {

      var x = dataX[i][0];

      var y = dataY[i][0];


      var predY = A + B * Math.pow(x, C);


      deltaA += 2 * (predY - y);

      deltaB += 2 * (predY - y) * Math.pow(x, C);

      deltaC += 2 * (predY - y) * B * Math.pow(x, C) * Math.log(x);

    }


    A -= learningRate * deltaA;

    B -= learningRate * deltaB;

    C -= learningRate * deltaC;

  }


  // Display refined coefficients A, B, and C in cells C2, C3, and C4

  var coefficientsRange = sheet.getRange("C2:C4");

  coefficientsRange.setValues([[A], [B], [C]]);

}

Finally, some yummy iteration code.

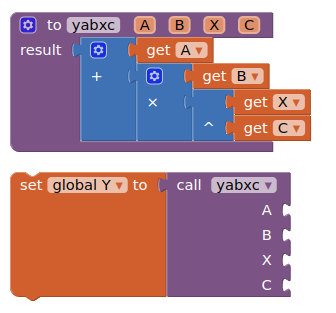
I don't do extensions, but this might make for a flashy graph demo in blocks under Clock Timer control and an epsilon limit or STOP button instead of that hundred million loop count.

(No promises)

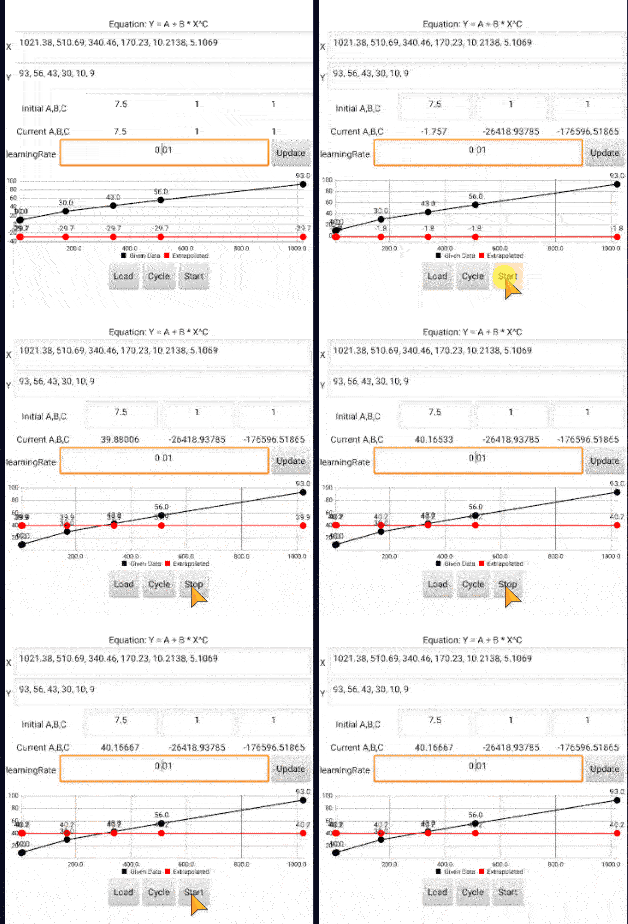
sample run
Here's a workbench app you can play with


nonlinear_least_squares.aia (7.3 KB)

P.S. It's more fun when you can watch the graphs try to converge.