Hello, i made an App to configure my ESP32 via BLE.
everything works as expected with the help of the community.
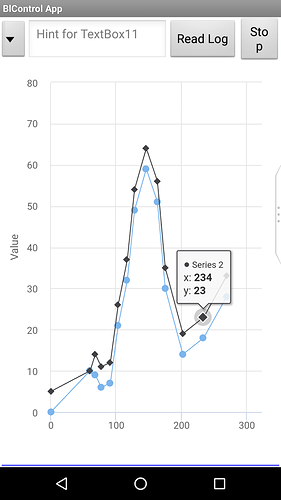
Now i want to make a Graph / Line Chart for Display some Sensor Data from the ESP32 (Voltage/Temp/...)
The Sensor Data is stored on the SD Card of the ESP32 and i want to read the Logfile and display it on the Phone. (Maybe with saving the data to a file....but that's another Topic)
The Graph should be scaled to 200 Datapoints (for example) when i start to read the Sensor Data.
After 200 displayed Points, the X-Axis should increase to 201 datapoints, 202 and so on...
Maybe up to 5000 Datapoints.
After read out all Sensor Data i want to Zoom (X-Axis) in the Graph to look at some details.
I know its no Problem in other App's programmed with Flutter or Android Studio.
But is it possible in App Inventor?
Which Chart should i use?
I think canvas cant handle my features?
Google Charts need connection to the Internet (Not preferred)
Maybe Chart.js?
ChartMaker?
HighCharts?
I dont want to test all available Chart's to see that it's not working. And maybe some had done something similar?
Greetings
John


