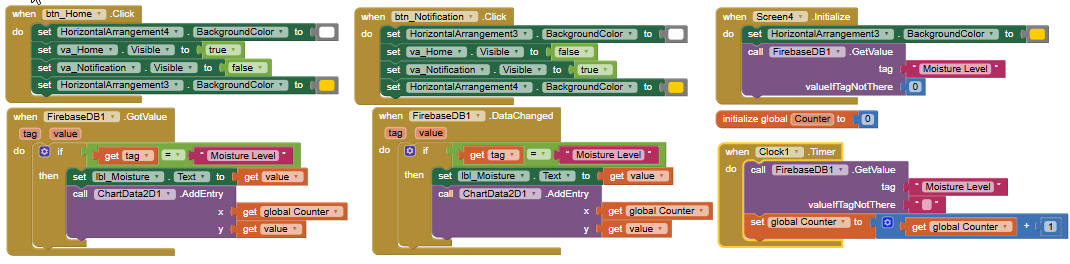
I created a graph for my application to display the moisture level changes in seconds. but the thing is, when data is overwritten, it will continuously add bars to the graph and the graphs compresses as more data are coming. What can I do to prevent it from compressing and prevent present data from covering the previous data? These are the blocks I used. I hope anyone could help me as I need to fix it urgently.
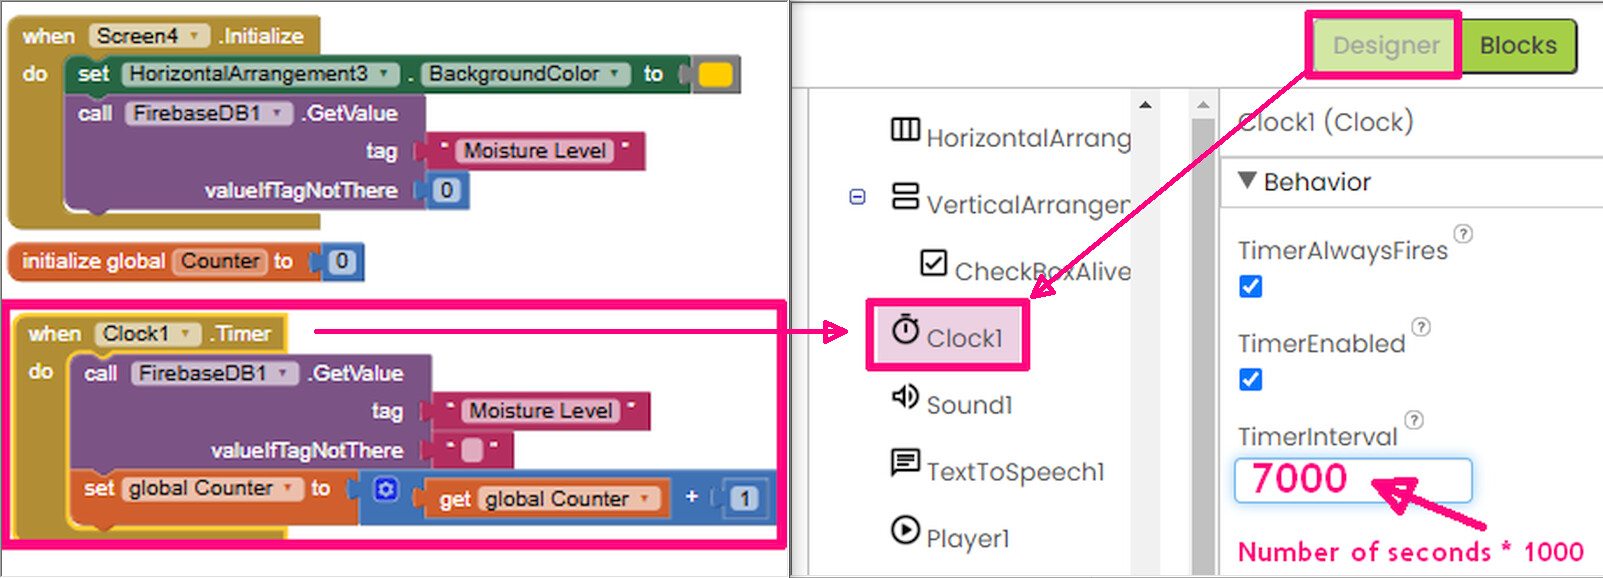
Due to the absence in the code of any command that initiates the timer (such as Set Clock1.TimerEnabled to »True) I estimate that the Timer is being activated by default on Clock Properties in the Designer ...
In this case, in the moment that Clock is added to the project, the default configurations of the Timer Properties come » to be triggered immediately [TimerEnabled] and with an interval of 1 second, expressed in milliseconds »1000 (in TimerInterval)
What is happening is that as it was programmed for FirebaseDB1 data to be read at the Timer's default frequency, this happens once by a second, causing new data to be updated in a frantic rhythm.
To resolve this, just go to the Properties of Clock in the Designer and change the default value of 1000 to the number of milliseconds that is convenient for a quiet reading.
If you put the 7000 value in this field, the Timer will only call the data reading DB1 every 7 seconds.
Let me know if this works... @janeth ![]()
@>-->---
thank you for your reply. but the timer interval I have is 3000ms/3 seconds. But it still the same.
The general pattern to keep the number of graph points limited:
In the event where you add to the graph or the lists feeding it, grab the list length or the data feed length and compare it to your desired limit. If too many, remove item 1 (the oldest).
Use a while loop for this if you wear a belt and suspenders.