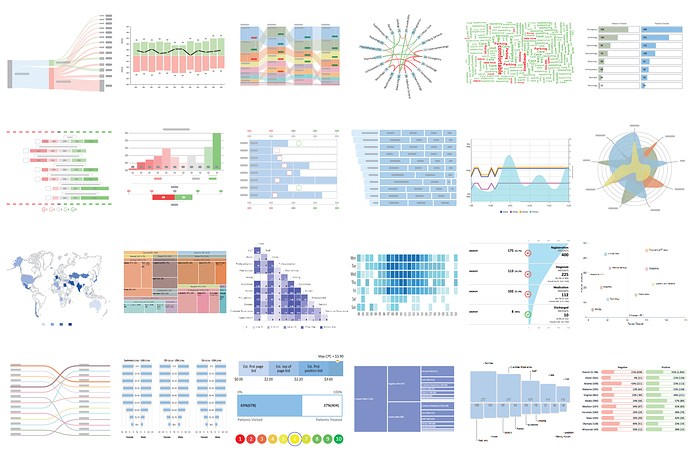
Hi Everyone, ChartExpo - Google Sheets and Microsoft Excel & Office 365 add-in. Easy to get 50+ charts or data visualizations. Get your charts/visualizations without any coding experience. Mentioning few charts like 8 levels Sankey, Likert, Slope, Sunburst, Treemap, Sentiment Analysis Chart, Customer Satisfaction Chart and many more new unique visualizations easy to create in few clicks.
Microsoft Excel & Office 365 Add-In
How I can integrate this within MIT App Inventor
Thanks & best regards,
