Data Visualization Add-In for Google Sheets and Microsoft Excel 365

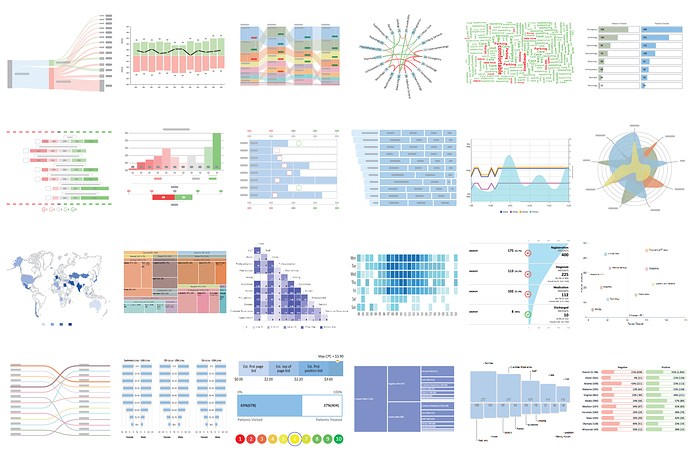
Hi Everyone, ChartExpo - Google Sheets and Microsoft Excel & Office 365 add-in. Easy to get 50+ charts or data visualizations. Get your charts/visualizations without any coding experience. Mentioning few charts like 8 levels Sankey, Likert, Slope, Sunburst, Treemap, Sentiment Analysis Chart, Customer Satisfaction Chart and many more new unique visualizations easy to create in few clicks.

Google Sheets Add-On

Microsoft Excel & Office 365 Add-In

How I can integrate this within MIT App Inventor

Thanks & best regards,
1 Like

Hi @m_aun welcome to our community!


At MIT AI2 the way we can create the chart is using WebView, ImageView, Canvas and
using an extension.

Useful Extensions :

📊 [Free] ChartMakerPlus - an extension to make google charts

[FREE] Charts Extension

[Free] [Beta] Simple Chart Extension v2 - Extensions - Kodular Community

https://community.kodular.io/t/linegraph-extension-customizable-linechart-paid/72594?u=taifun

Useful Links :

FAQ Section: Charts and Graphs

🟩 HOWTO: Get Chart Image from Google Sheet

1 Like

See their documentation here:
https://chartexpo.com/Home/Documentation#FaqsWebMobile

2 Likes

Thanks for this link. But there is no information regarding integration with MIT App Inventor.

You will need to use a web viewer and construct your own html/css/javascript to display their charts

1 Like

Thank you let me try this solution and share the progress if done.

1 Like