hello there, how you all been doing?
I'm making an app to track the water intake that received it's data from esp32
there's 7 button representing each day on top of the chart, if user want to click a button, for example the thursday button, it display the chart that was recorded on thursday.
i have succesfully made the app to create a chart based on the input it receive from bluetooth.
so the screen initialize, then it reads data from tinydb to display the current chart
but when the user want to see the previous data from yesterday, or any other day, it display that set of data.
what i thinking was to make 7 chart component then only display one which is suitable.
so the data was kinda like this
(list day1) (list chartX)
(list chartY)
(list chartLabel)
(list day2) (list chartX)
(list chartY)
(list chartLabel)
(list day3) (list chartX)
(list chartY)
(list chartLabel)
and so on..
is this a good approach or there is a better way?
if this is a good approach, how can i do that?
thank you
edit: i forgot to attach the aia file
this is the aia file i use, the Y value i'm going to use is the airDiminum variable
Main.aia (546.3 KB)
Dnt get you point... you are storing these 1 day data in 1 tinytb tag or seprate?
the tag was the day1 and the rest was the value, i guess
i'm not insisting on my method, feel free if you have another method
its better if you show blocks pics
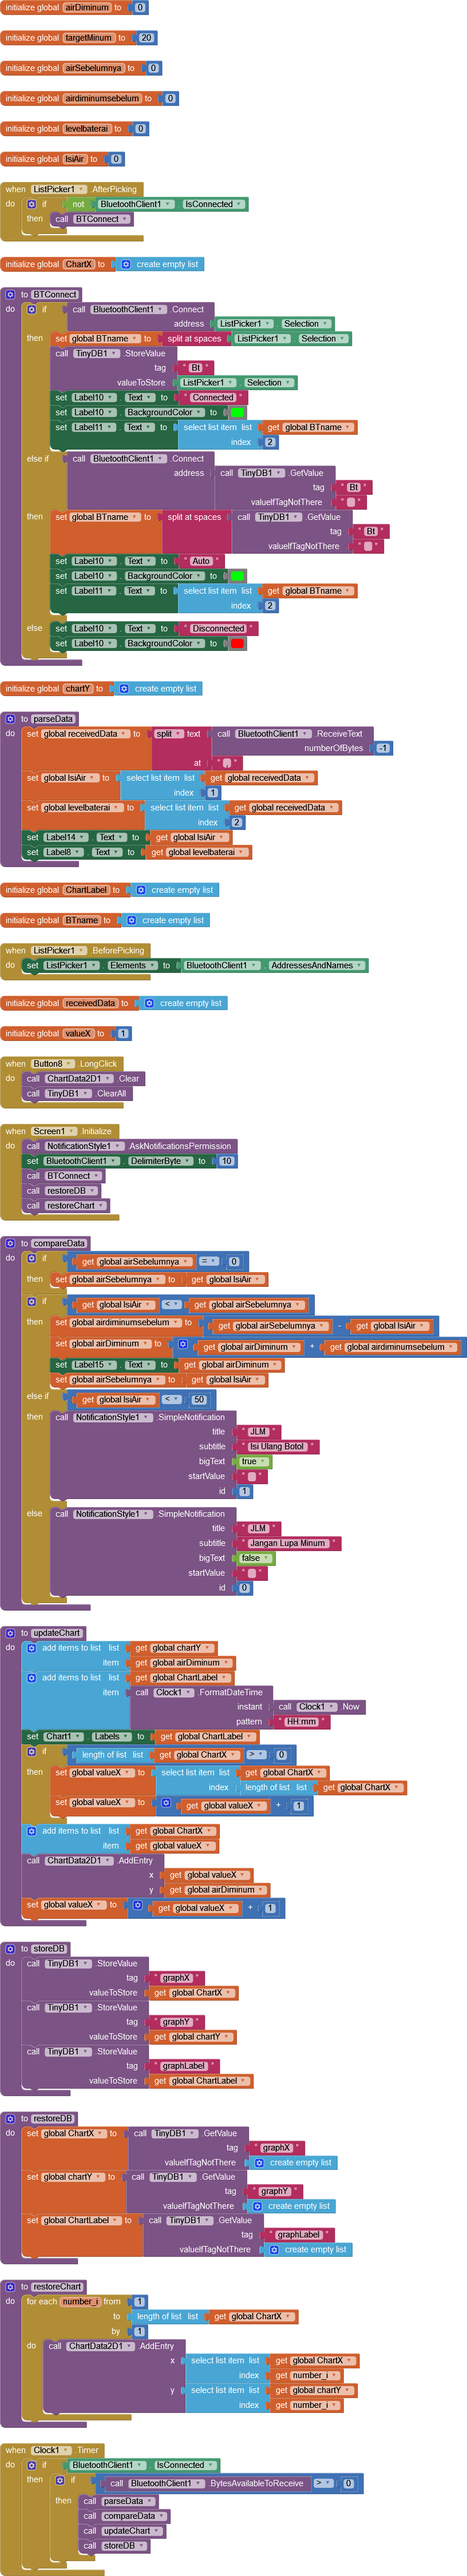
post updated with the block pics.. i haven't done anything to achieve the goal,
the code was just receive the text from bluetooth, split it into two variable
bunch of comparing the data, making the chart, then save it to tinyDB
Here is how to save the raw data, reading by reading, to make it available for later analysis.
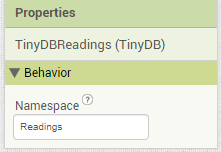
Add a second TinyDB, and rename it and give it a new NameSpace for just readings.
In your Clock Timer store the two readings along with Clock1.SystemTime into the new TinyDB under tag SystemTime, the perfect time stamp for this.
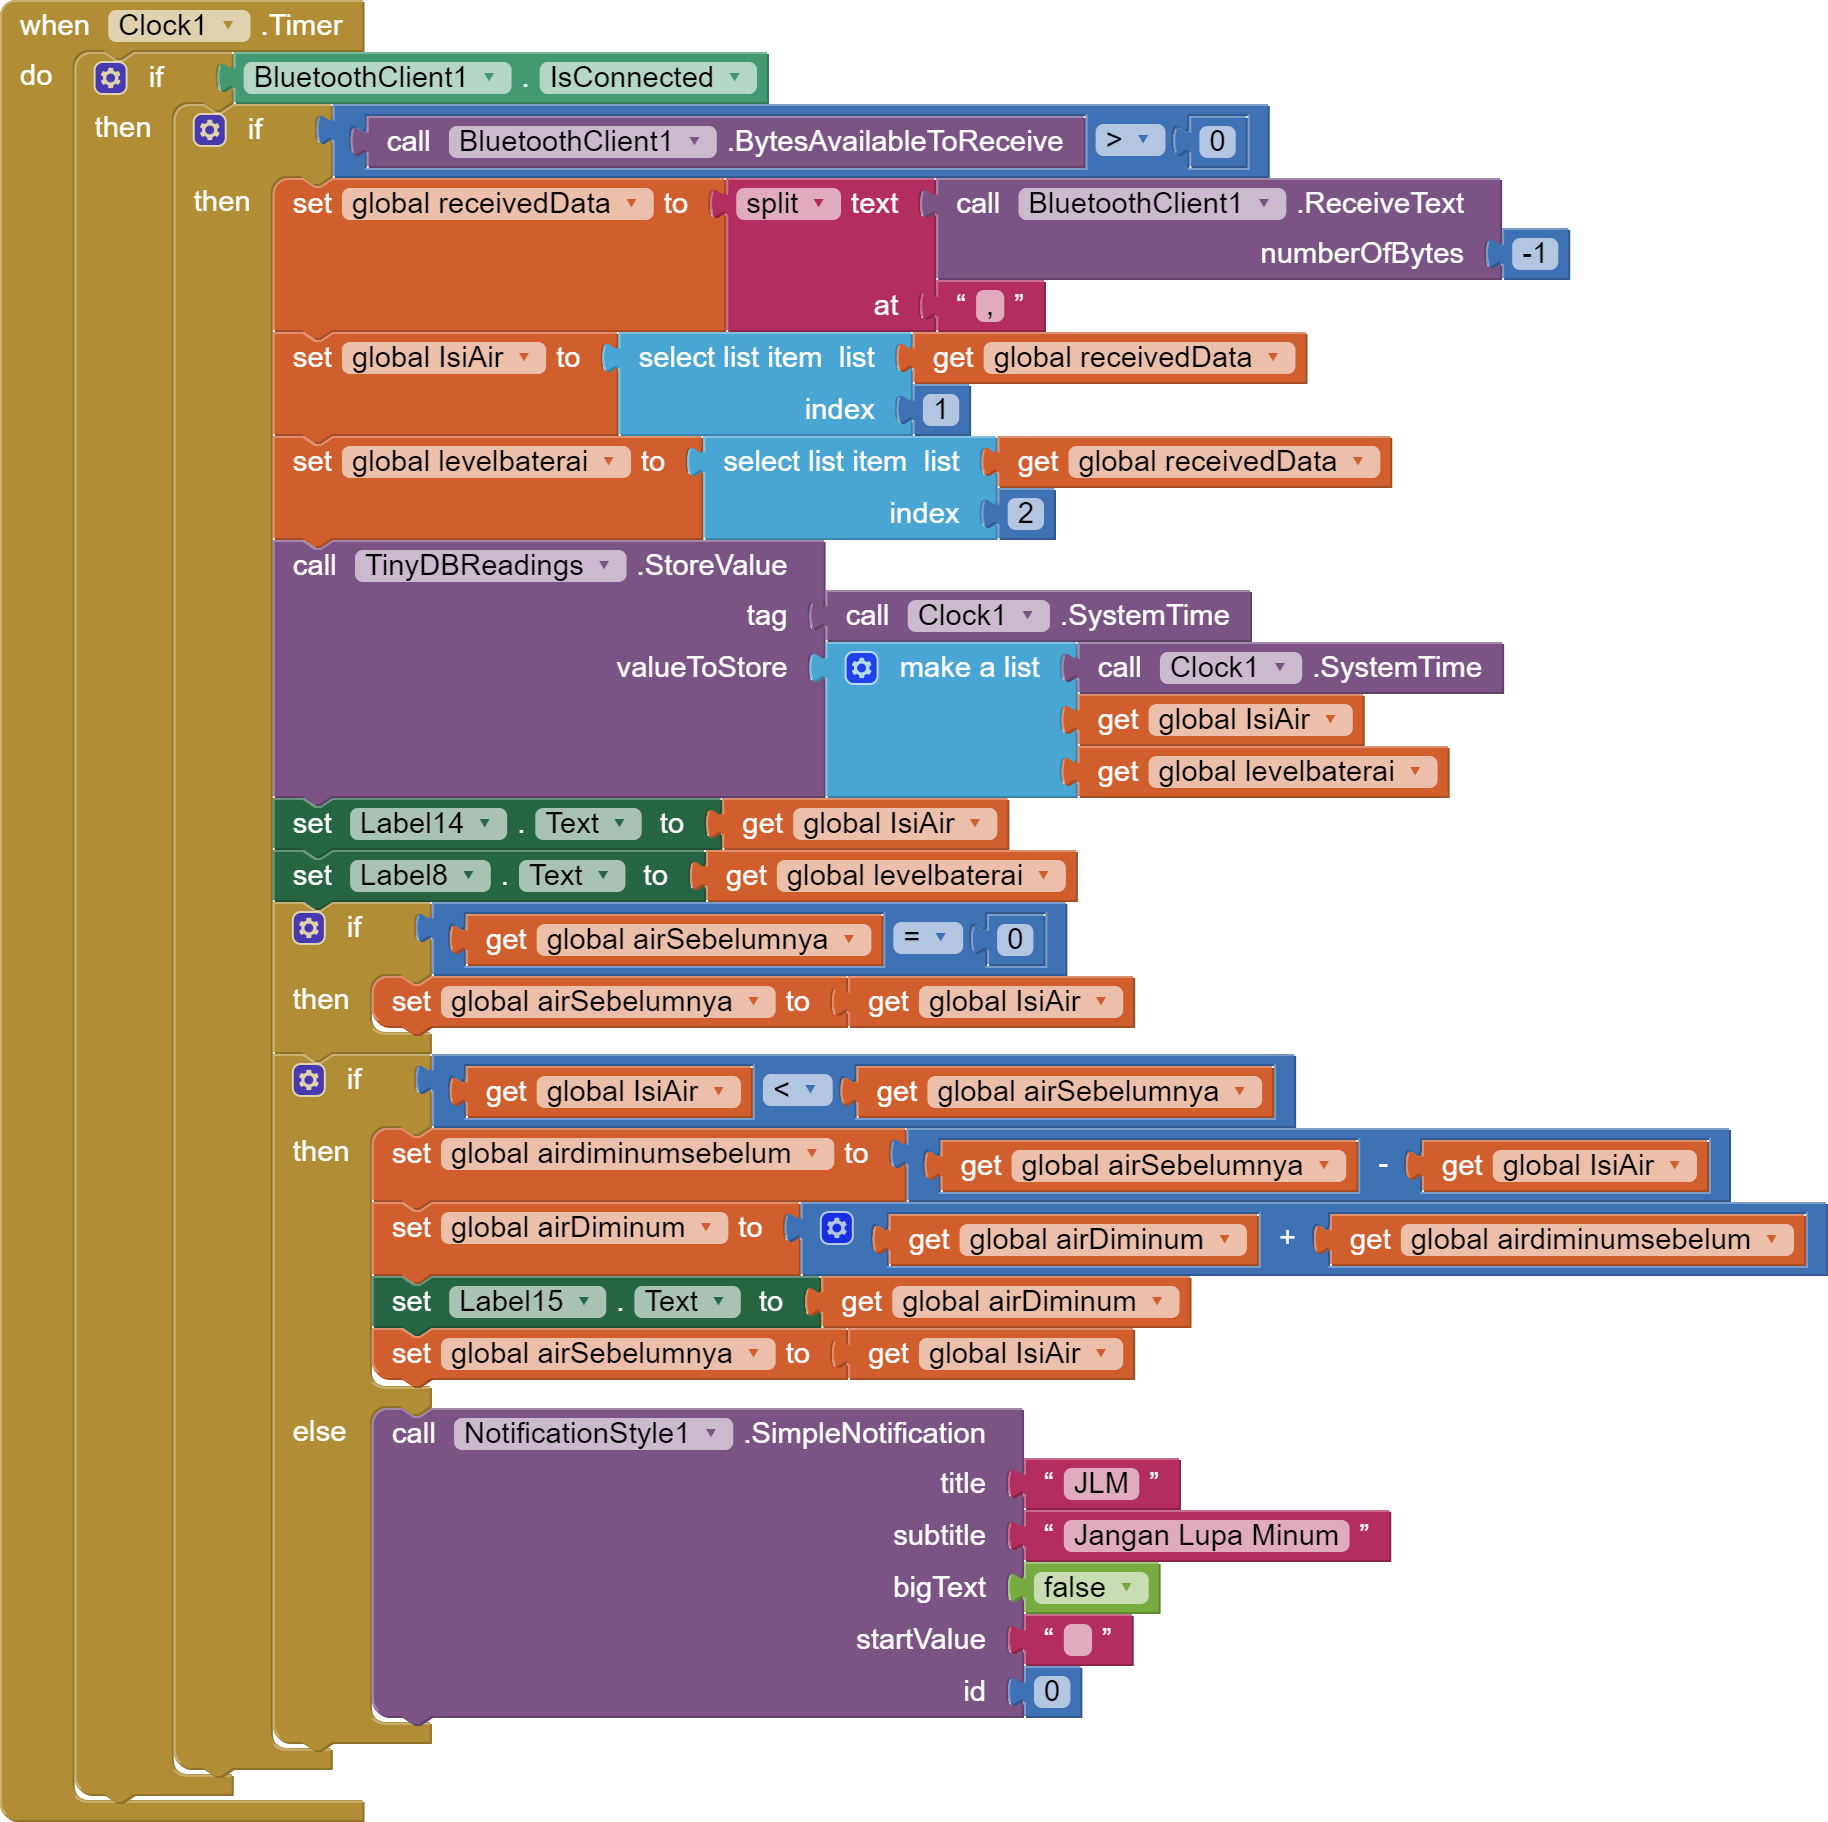
(draggable)
This block will give you a three column AI2 table of all your readings, in time order, ready for you to filter and graph.
i see, thanks for your input, however i still could not figure out how to filter the data,
also, the data i'm gonna use is the "airDiminum" variable as it's Y chart.
what should i do?
Look through the advanced list blocks until you find the block whose name includes the word Filter.
Use Clock blocks to convert starting and ending date time to milliseconds, and use those for upper and lower bounds.
There is an article on advanced list blocks in FAQ Section: Lists
Read the charts usage guide in the charts FAQ
hi, thank you for your reply, in deep consideration that i have considered to give up on this feature for now.. sorry..
This topic was automatically closed 7 days after the last reply. New replies are no longer allowed.