Hi everyone
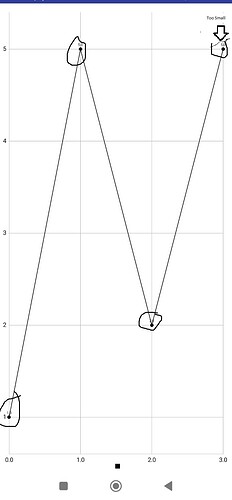
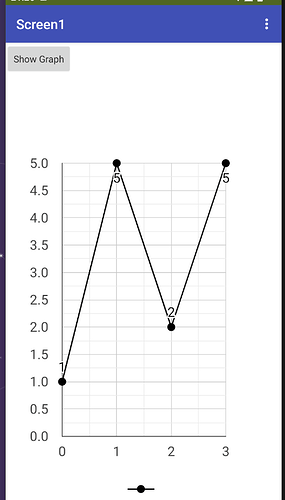
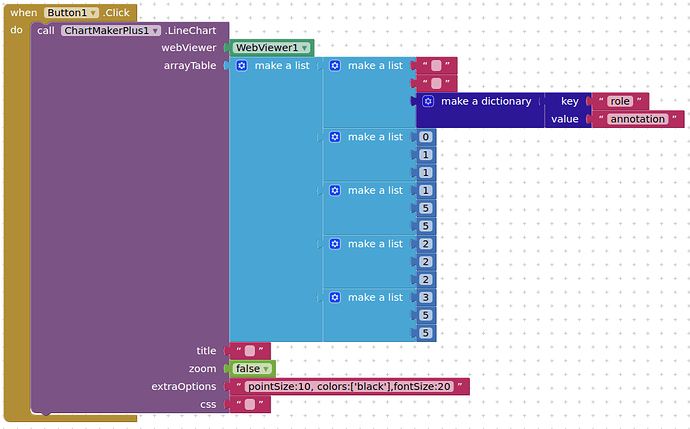
why are the graph values in my app so small?
Is there a way to enlarge them?
Thank you.
Not with the bare bones MIT AI2 Charts components.
If you want to get fancy, see
(I don't do fancy.)
so i need to use an extension?
Not necessarily.
See the various sections of the FAQ;
Canvas, Web Viewer, etc.
I have seen the sections but there is none that talks about enlarging the values. How can I solve this?
I really need it
So you will be the first.
The Canvas has blocks to change the font size.
The WebViewer deals with HTML and Javascript and CSS. I'm guessing the Canvas is simpler, but you would have to go and draw everything yourself.
It's like Pareto's Principle:
The first 20% of the work gets you 80% of the results, but
the last 20% of the results will take you 80% of the effort.
(You, not me.)
Thank you so much for the advice
This topic was automatically closed 7 days after the last reply. New replies are no longer allowed.


