Try entering null for your months with no data
how would it be?
null is a block?
where do i find it
do you have any example?
No, null is a text (not zero or blank, but nothing), but google charts should see it as null
Try it with the example chart here:
https://developers.google.com/chart/interactive/docs/gallery/linechart#curving-the-lines
[ ['Year', 'Sales', 'Expenses'],
  ['2004',  1000,      400],
  ['2005',  1170,      460],
  ['2006',  660,       1120],
  ['2007',  null,      null]
 ]
Hi everyone,
I was trying to use the ChartMaker plus extension
but when I click the button to view the graph I get an error
"Data column(s) for axis #0 cannot be of type string"
how can I solve it?
Thanks.
Pricetrend1 (1).aia (13.5 KB)
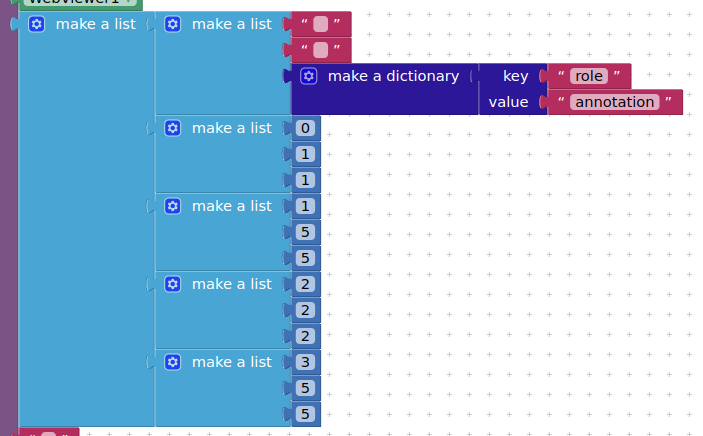
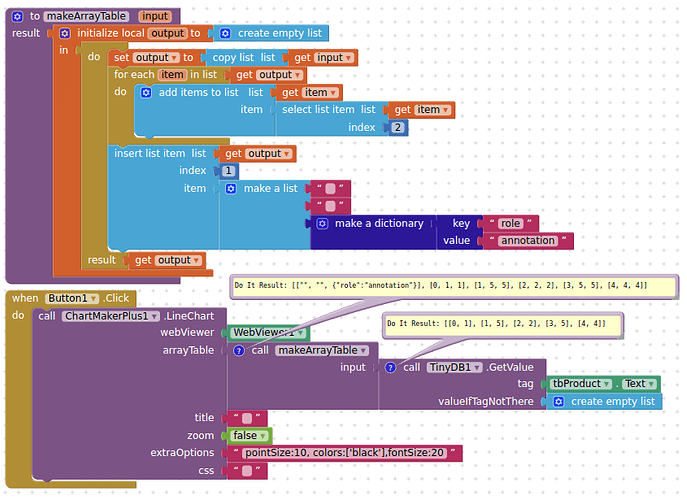
Look again at the example I gave you. You need to include header values for x/y, and more importantly the dictionary that will show the labels ! You also have to duplicate the second value for the label.
sorry but how do I do it with tiny db 1
Sorry for my ignorance but I don't understand much about it
You should be able to see what your "arrayTable" needs to look like, from my example. You will need to add the required items to your list coming from the tinydb so that it has the same format.
and how do i make the list of tiny db
in an array table?
OK, I guess an example will be forthcoming....
It doesn't work ![]()
are you clearing tinyDB before a new test?
yes
oh well I forgot to put a block
now it works perfectly
Thank you very much😁
I hope I don't encounter any more errors!.
thank you all.
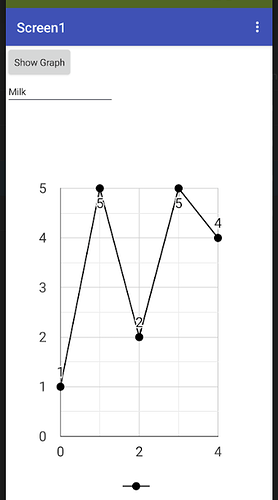
Hi everyone, I wanted to know if it was possible to click on a value in the graph and say some more information about when that value was added.
Thanks


