I am confused about making a line graph from the data in the listview below.
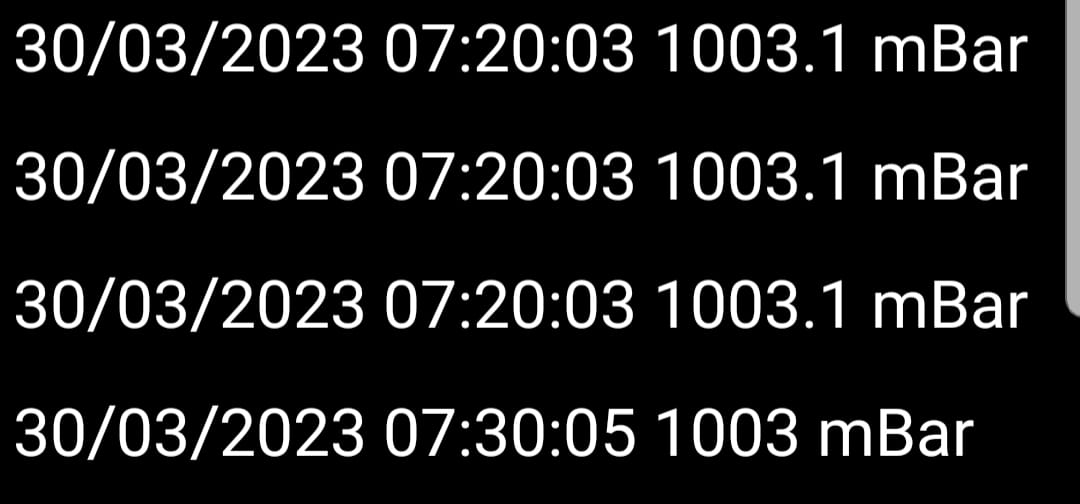
the data keep updating
by the way, how do i make the hours as the X line, and the number before the mBar as the Y line.
I am confused about making a line graph from the data in the listview below.
You might start here:
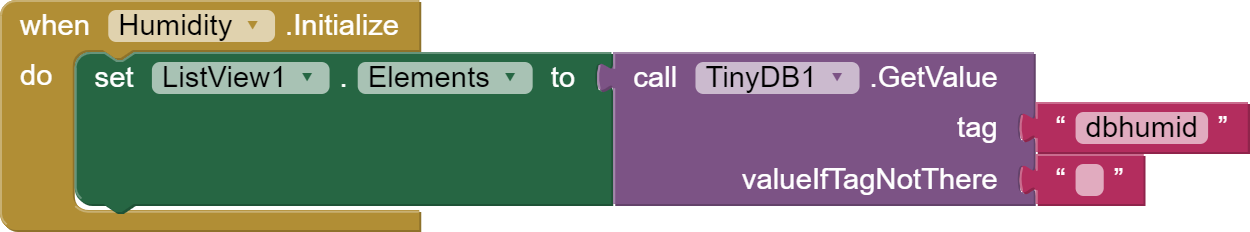
Store the data in TinyDB as a table (list of lists), not as a list of display Elements.
The AI2 graph component has no Element support.
If you need Elements, format them from the table in a separate procedure.
The easiest storage format for time series data is as a two column table
You could subtract the first timestamp number from all timestamps, to get just milliseconds from start of time series. That makes a nicer x value.
You say you want x in hours.
Hours from start of run, or hour of the day?
Start of run is just division by (millseconds per hour).
Hour of the Day can be gotten using the Clock's time conversion and formatting blocks.