For my project i am working with a Chart/2D Chart.
I would like to set some x- and y- coordinates myself, by typing them in a text box first and then displaying the x- and y- coordinate on the chart.
Is there any easy way to make this? 
for display, i would like to type in the x- and y coordinate and then by pressing the button, the x- and y- coordinate should not only be displayed as a text, but also in the chart.
I already did the text thing, but i cant seem to find a solution on to how to make the chart-part happen.
Thank you in advance

If I remember right there is the add entry block to insert a new value . You have to pass both values X and Y so probably you have to use only one button and not 2 as I can see in you project.
You can also save the data in a variable to store them and retrieve when you want , you have to use import from list and you list must be a list of list where each item is a list of two elements (X,Y)
For more detail read the docs  HERE
HERE
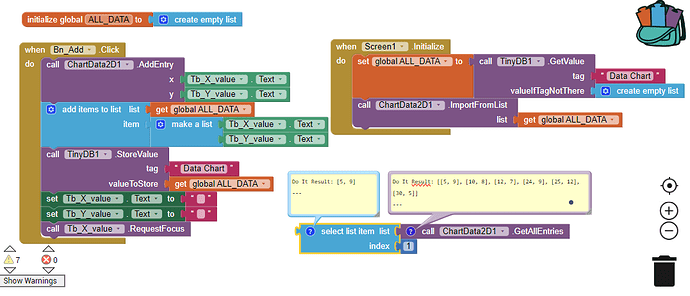
I did a little example.
Click button add the values , save the data in a variable, save data into tinyDb, clear the textboxes, focus on X textbox for a new entry, call all your data when screen initialize.
You can see the list of all the Entries like a list of lists and the first item is a list of two values (X , Y)
Refer to the docs for more details 
1 Like
Thank you for sharing! I will try it out and update you! thank you so much <3
1 Like
Where would I get the TinyDB1 Blocks from? what exacly is "TinyDB1"?
Hi, I don't know if you need it but in my example you can save data also in tinyDb .
TinyDb allow you to save data in the app so you can resume them also after closing the app. DOCS If you don't save data in a persisten database everytime you will open app you will not find your new data
You can find it under storage component
Ah yes! Thank you sososo much <3
1 Like
it's a pleasure. Test it and update me if you solved 
Do I need to connect this Block somewhere? Or can it be just like that?
ty

I don't know why  probably because you haven't create the entries yet ?
But this was a screenshot I made to show you how data are stored inside chart, so I leave it unsocket
![]()


