Hi there. I am not great at logic and I am trying to make a graph to tell how many books were read in each month.
I've created 2 variables, one named MesAdicionado that takes the name of the months that were sign in and a variable named LivrosDe that has all the information of the books (Title, Author, Publisher, Year, Pages, Score, Month Read).
How can I do that?
Thank you.
What values do you want your graph to show ?
What type of graph ? - line,bar,column,pie,other ?
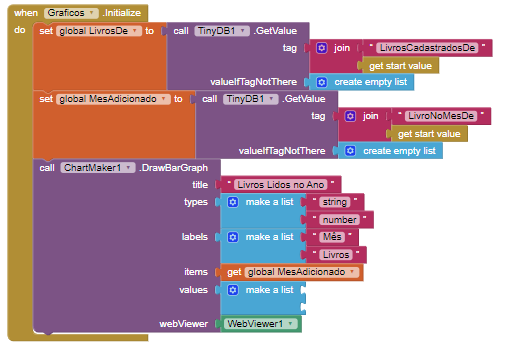
I've used an extention to make the graph.
All the information is correct, the only problem is in the "values" part.
Right now I have 2 books on the month December and one in the month April, but I dont know how it can identify the difference on the months.
I've tried to make a different variable and add the title to the month, but I thought it was too much, that it had an easier solution.
What do you think?
That doesn't really show what values you want to show....
Could I also suggest that you use the ChartMakerPlus extension, it is meant to be easier to use, and offers more features/customisation.
I am using TinyDB, dont know how to use Google Charts, sorry.
I have to have it done today.
Let me know when you are ready to provide the data you want to chart...
I am tring to screenshot the graph, but the app keeps crashing. ![]()
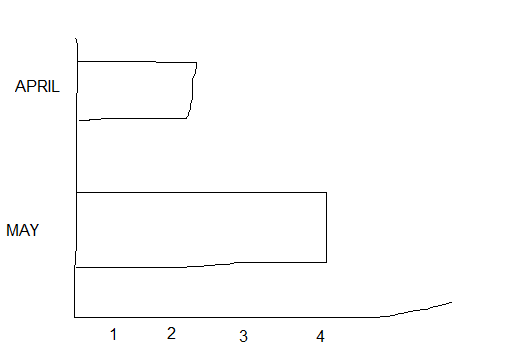
Thats bassicly what I want
Right now I have 2 books on the month December and one in the month April, but I dont know how it can identify the difference on the months.
I've tried to make a different variable and add the title to the month, but I thought it was too much, that it had an easier solution.
What do you think?
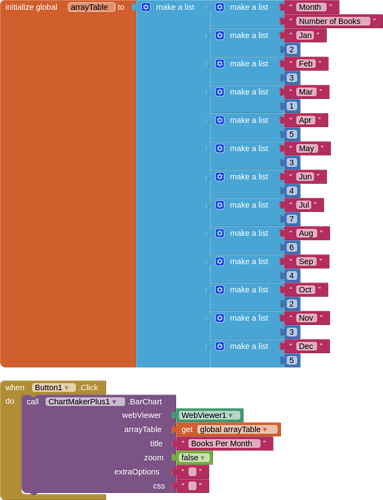
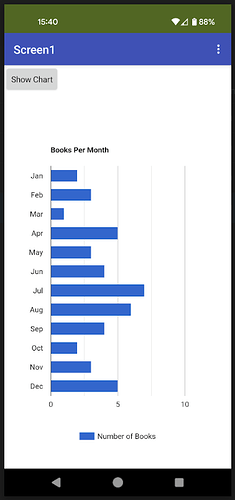
From what you say, you want to chart the number of books for each month ?
booksPerMonth.aia (13.2 KB)
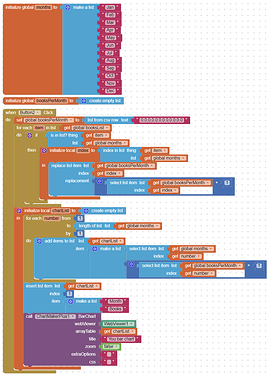
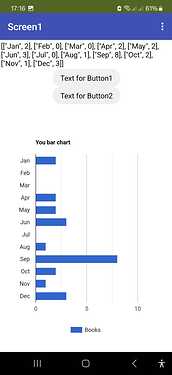
If I don't remember bad you have a list like this...so you can count the number of the month in the list and then create the chart:
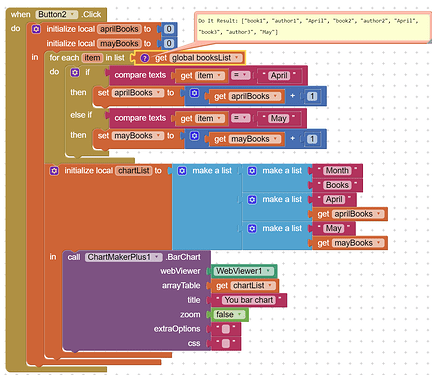
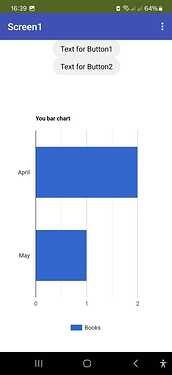
another approach:
This topic was automatically closed 7 days after the last reply. New replies are no longer allowed.
