Hello everyone. New to AI2. I just managed to build a "calculator". The rusult is displayed in a label so I think it is considered a string. The possible results are limited (0 to 25, integers). I would like to know how I can store each single result in TinyDB and be able to view the data in a bar chart. What I want to achieve is to have every possible result along the X axis and the occurrences for each result along the Y axis. Basically after each result it should increment by 1 the occurences of that result.
Thanks in advance for your help.
Hello ABG, I don't understand how to do this: for example, if the result given by the calculator is 25, and the values are x=25, y=1, I want the y value to become 2, and next time I get another result of 25 then y=2+1 and so on.
I have been trying to read your suggestions and played around with them, but I don't seem to understand the logic of some blocks.
Thanks in advance if you reply again.
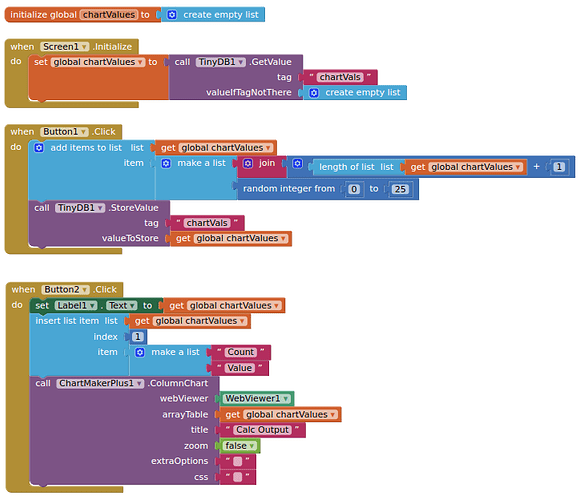
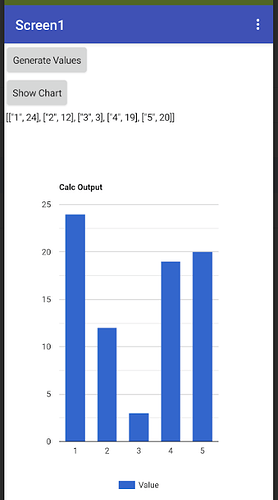
Something like this?
For a google chart, you will want your count items to be strings, and your calculator outputs to be numbers.
I missed the part where you want to flip x and y.
Most people add 1 to x.
Now I reread the original post, and wonder if you are looking for a histogram?
Yes, a histogram. I wasn't clear enough.
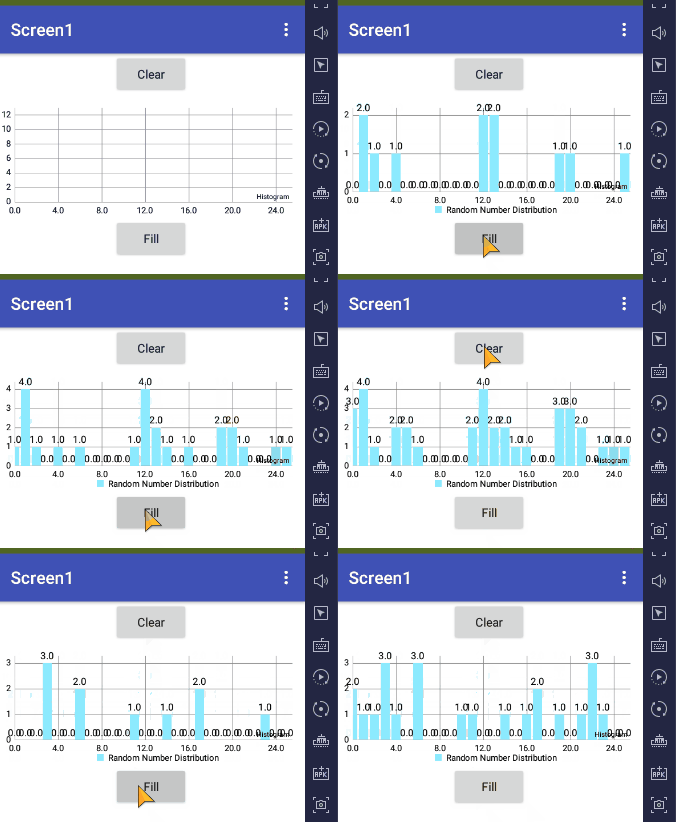
Here's an implementation using the AI2 Charts component with a TinyDB data source:
Sample run:
Source:
histogram.aia (3.1 KB)
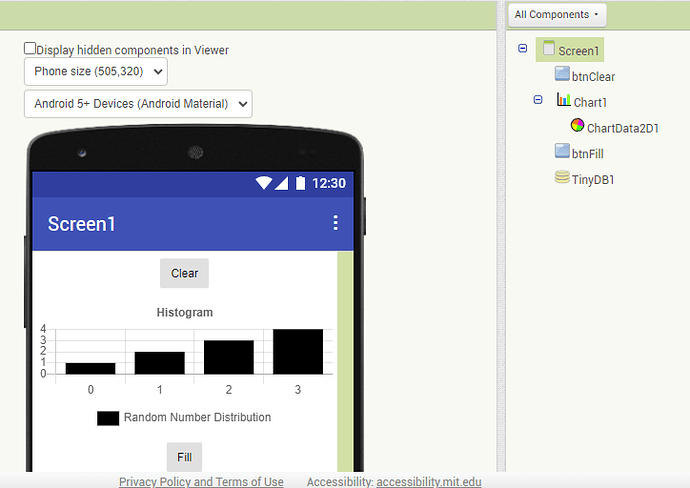
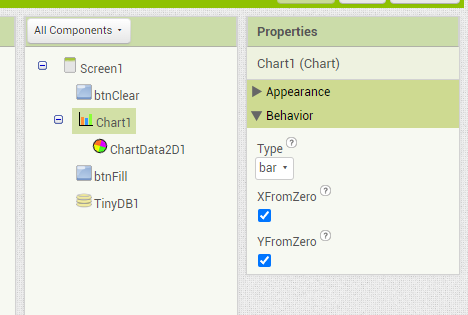
Designer:
Chart:
ChartData:
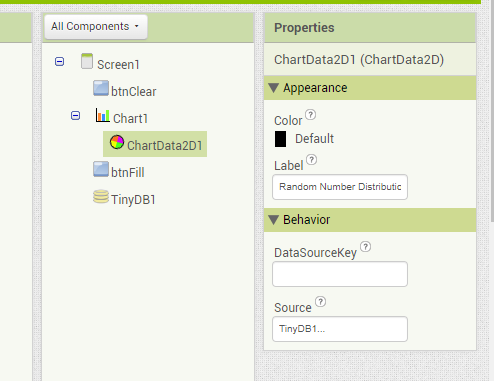
A constant TinyDB tag:
Clear Button:
Fill Button:
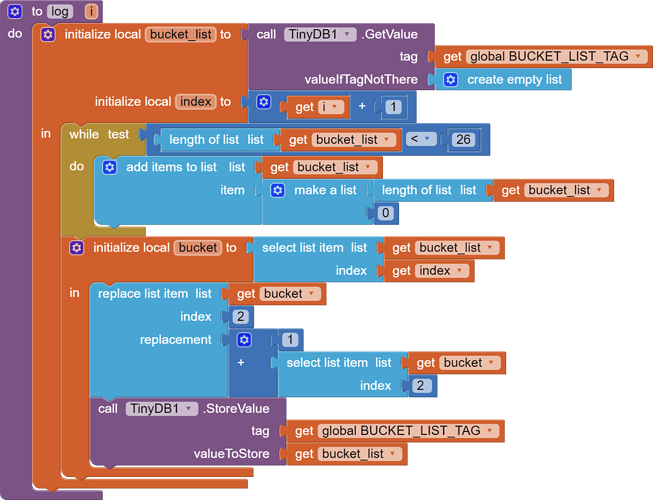
Log procedure:
Note that I took advantage of the integer domain to translate randoms to values within AI2 index range (minimum 1).
The while loop to extend the bucket list all the way is a little wasteful of cpu, but what's a little cpu among friends?
