This tutorial is intended for people who need to display a heavily customized scrollable window into a large table. It can also be used as a CardView.
(I needed a pithy title, and "The Elder Scrolls" was taken.)
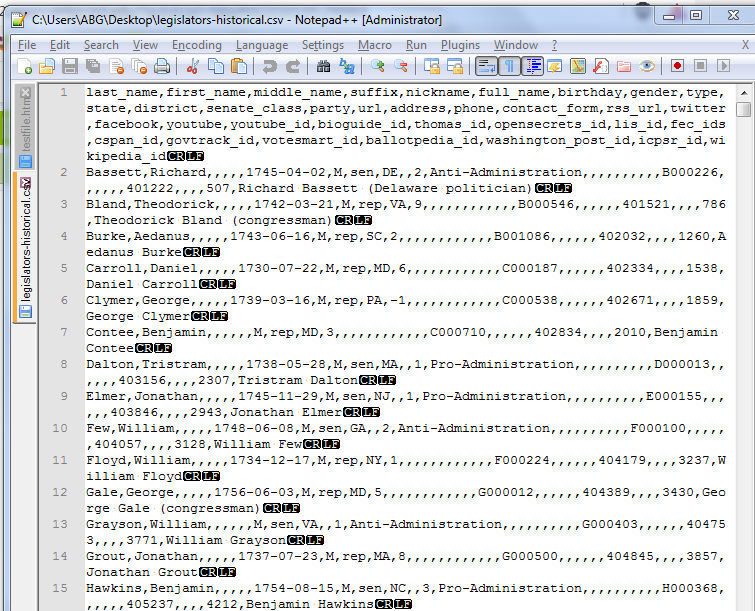
My sample subject area for my data is the historical or current set of legislators in the US Congress, both Representatives and Senators, with photos (where available.)
Credits for the source data:
- Data from https://github.com/unitedstates/congress-legislators
- photos from https://bioguide.congress.gov
Source code:
table_window.aia (508.1 KB)
I have embedded my two source CSV tables in the assets of my .aia file for load at startup, but the photos are loaded dynamically from the congressional bioguide site when the app user stops scrolling, to reduce the chances of the app acting like Denial Of Service attack.
The columns for my sample data files are the same, only the time spans differ.
The historical data table is quite sparse, given the 18th century data.
This sample is all about the scrolling.
Things I did not bother with for this sample:
- Choosing which file to load (historical/current)
- filtering
- sorting
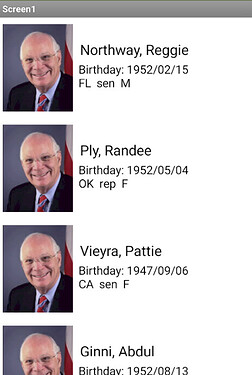
Sample run, using current data:
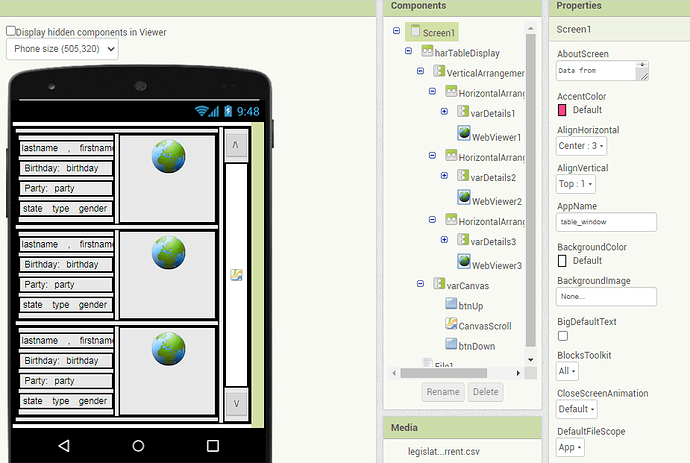
The Designer (overview):
From outside in, the table view consists of
- a nonscrolling Screen1
- a Horizontal Arrangement holding the table window and the scroll bar
- a Vertical Arrangement stacking at least 3 table row details
- a Vertical Arrangement stacking
- an Up button
- a thin (10%) Canvas
- a Down button
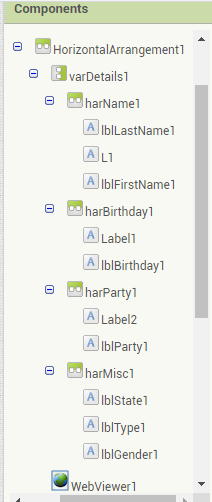
The table row details are Designer copies (Ctrl-C, Ctrl-V) of the first table row detail Arrangement, which was the finickiest part of the app, trying to squeeze in data from 7 columns of the CSV file:
Note how I renamed the important Labels to reflect their contents, with a terminal '1' for AI2 autonumbering when I copied and pasted the enclosing HorizontalArrangement1 inside the Vertical Arrangement varDetails.
When you have copied (Ctrl-C) the first detail Arrangement, be sure to click (focus) on the enclosing Vertical Arrangement so the Ctrl-V pastes land the copies into the proper container, after your first detail Arrangement.
Once I have a well named collection of display components, it's time to collect them in the Blocks Editor to support iteration over the display:
Notice how the three rows of components appear in the same order as they are displayed, to keep things simple. The actual input order of the corresponding CSV table columns is in
The WebViewers are in a separate list:
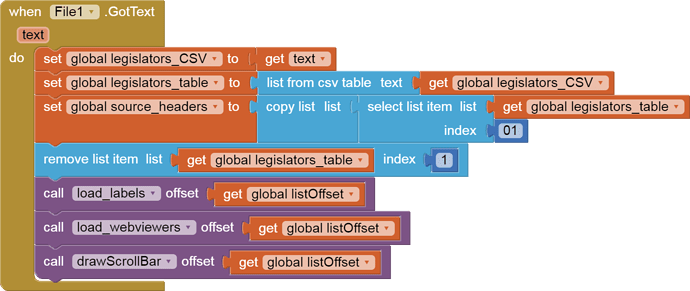
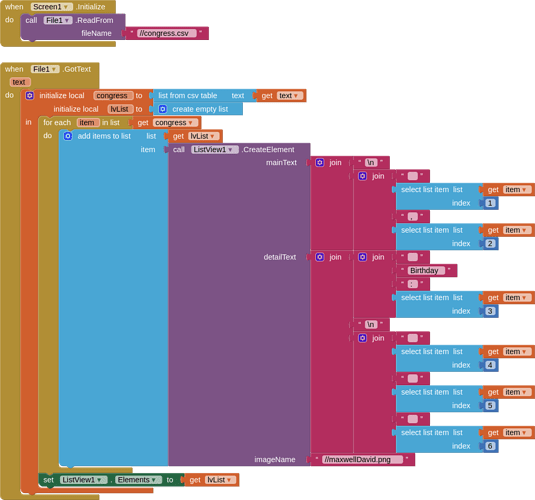
Initialization:
I left out niceties like choosing which file to load.
For debugging, I copied the incoming file to a global variable before doing CSV to Table conversion.
I copied the first row (headers) for safekeeping in case I would use it later. (I didn't)
Then I removed the first row, leaving only data rows.
The scrolling relies on a global variable

, initially 0, intended to hold how far down we have scrolled, measured in row count.
At startup, all three parts of the table display need to be loaded:
- the Canvas scroll bar
- the Labels
- the WebViewers
I did not bother to parametrize the shared global variables holding the source and display tables
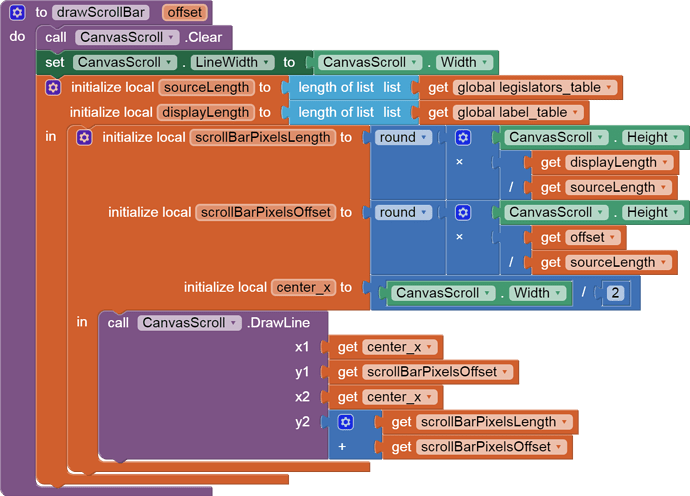
Drawing a scroll bar consists of
- erasing the scroll Canvas
- mapping the offset (0 - source table length) into a y value
- setting the scroll bar length to show the ratio of source to output table lengths
- drawing the scroll bar as a fat line down the center (x) of the Canvas
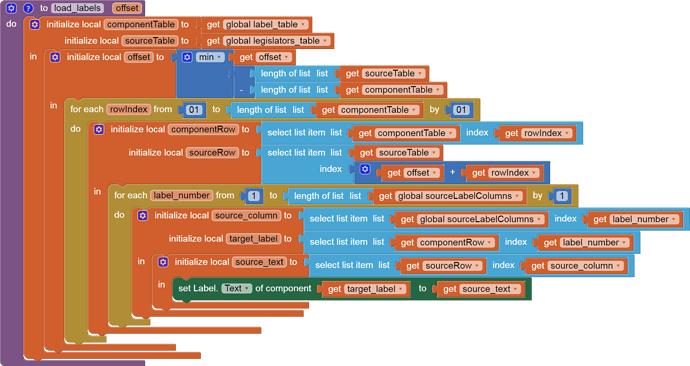
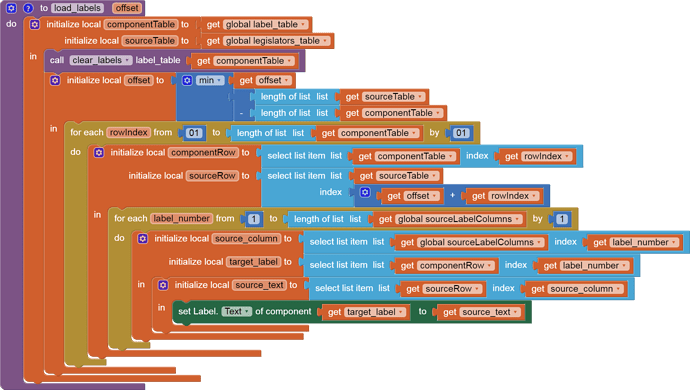
Filling the Labels:
I hardwired the source and target tables here. Feel free to parameterize them as needed.
To avoid running off the end of either table when looping through the indices of the target table, I limit a local copy of the offset using the minimum function.
That lets me fill the entire Label table. (This might need further work if you start to filter the source table so far that its length is less than the length of the Label table.)
Once I have lined up a row of Labels and a row of data from the source data table, it is time to fill in the Labels of that row from that data row. This is where the list of source column numbers is needed:
That list maps the seven Labels into the corresponding input table column numbers, to allow the Labels to filled in a loop.
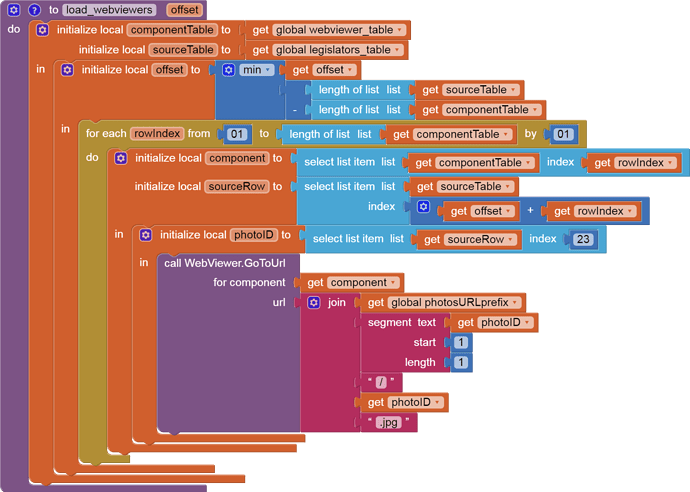
Loading the Photos:
The outer layers of this procedure were copied from the load_labels procedure, since the same logic applies to lining up source rows and target components.
The URL for each photo is built using column 23 of the source table and the URL prefix
The bioguide web site keeps 26 alphabetical subdirectories of photos based on the first letter of the last name, hence the extra work building a URL to scrape the photo.
Controlling the Scroll:
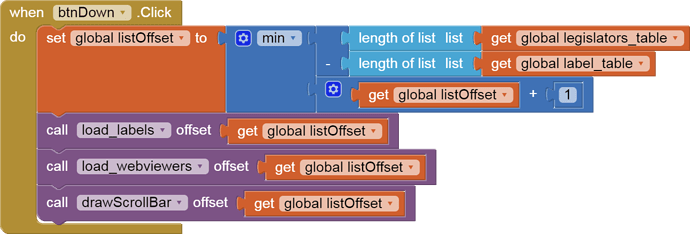
The Up and Down buttons:
The Up Button has to watch out that it doesn't run off the top (item 1) of the source table.
The Down Button has to watch out for the ends (length of list) of both the source (legislators) table and target (Labels) table.
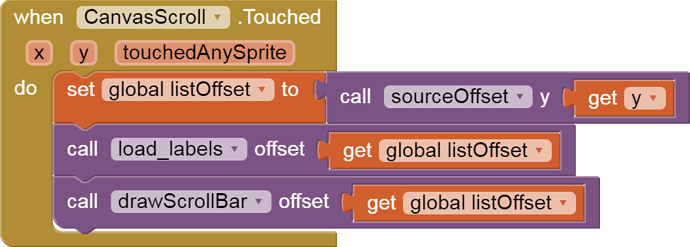
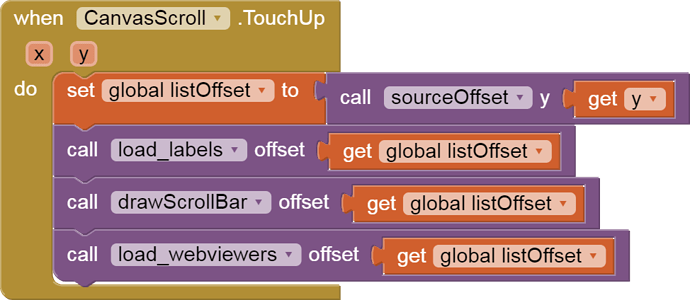
The Canvas controls:
The y value of the Canvas touch point needs to be mapped into a new offset into the source (legislators) table.
To avoid overloading the Congressional photos site, we don't bother trying to load photos during a drag.
Eventually we have to remove our finger from the scroll canvas. That's a good time to complete our web scrape.
Summary:
I have shown
- a sample table load from a file
- how to set up nested Arrangements for a small fixed number of detail rows
- how to line up the scroll bar Vertical Arrangement with the detail rows
- how to maintain a global offset variable to match the target display components into the source data table
- how to dynamically show the scroll effect in the scroll bar and in Labels during a drag
- how to avoid overloading a web source during a drag.
I have not shown
- how to choose input files
- how to filter or sort input
- how to deal with source data that doesn't cover the output components* (see Go Scroll Yourself! blocks only (No extensions, No JavaScript) - #15 by ABG)
