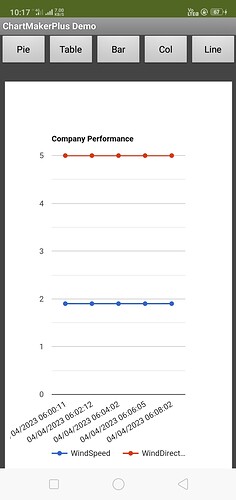
I'm new into making a chart. I decided to learn about it but still have no clue about making any chart.
I want to make a chart from the image below
Hmmm, this would be a messy line chart or bar graph, you have 8 different parameters all with different scales, and you have to handle the date and time. It might be better displayed in a table ?
What type of chart (or charts) do you want to make?
Make several separate charts for each weather parameter.
You can use the AI2 chart component for this.
Your x axis should be in minutes from the first reading.
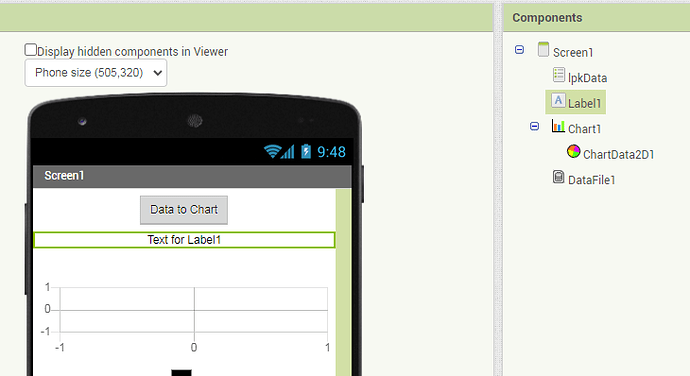
You need a separate chart data component for each column of your CSV.
Show the base date time in a separate label .
Post your CSV file.
P.S. The Clock component has the time format conversion blocks you need.
actually, i just need to draw 1 or 2 parameter, not them all
Which parameters?
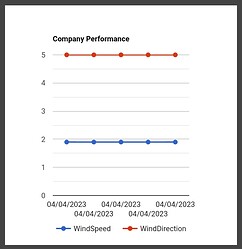
Wind speed and wind direction (i want to make a line chart)
OK, wind speed will be in knots (?) ranging from 0 - 100(!), wind direction will be in degrees or a compass point. How do you envisage displaying both of these in a chart (what do you want the chart to look like ?) ?
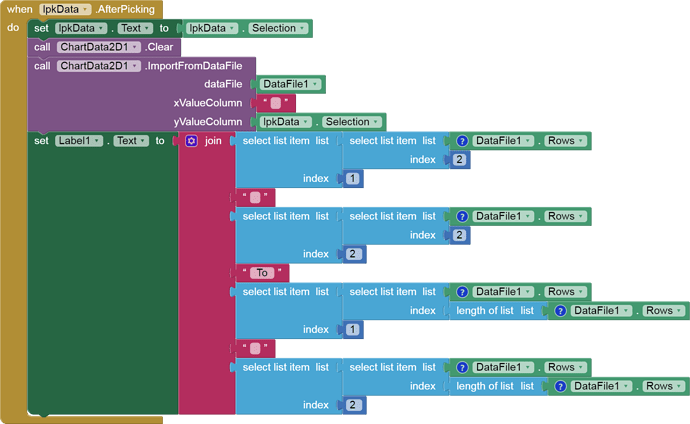
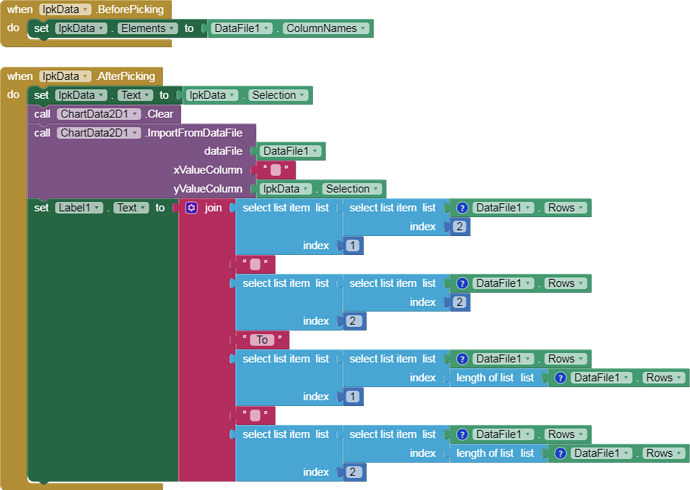
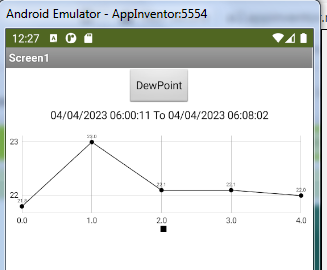
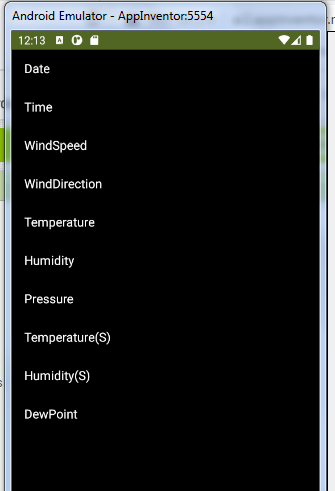
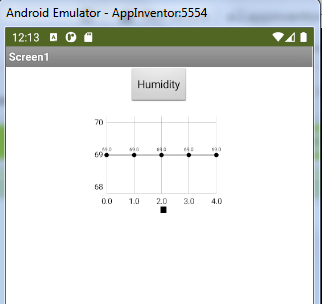
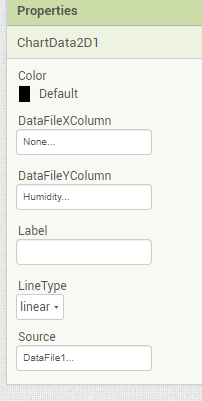
Here is a sample showing off the new DataFile component in relation to the ChartData and Chart components.
Aside from 'knowing' that the date and time entries are in columns 1 and 2, this app works entirely off the csv file's headings.
AWS-111111[1].csv (394 Bytes)
multi_chart.aia (3.2 KB)
multi_chart.aia (3.2 KB)
This sample should also help any one faced with the problem of using date times as their x axis.
(added to FAQ)
two line in 1 chart
i think?
thank you!
yes, but how?
I have used the same @Taifun demo aia..
ChartMakerPlusDemoV1.aia (45.7 KB)
Plss see only the line chart block
Add extra ChartData components for more lines.
This topic was automatically closed 7 days after the last reply. New replies are no longer allowed.

